How to use debugpy in VSCode
I was recently watching a talk on distributed training and came across a command debugpy in vscode that the author used to debug python scripts in a small cluster.
The tool debugpy can be used to start a debugger either in a local virtual environment, a Docker container or on a remote server and then can be attached to set breakpoints and debug a script from within your local VSCode.
Here are my notes on how to use it.
Step 1: Setup the remote debug server
To use it, we can install it on the server as:
shell
pip install debugpySuppose we want to debug a simple script that doubles a number.
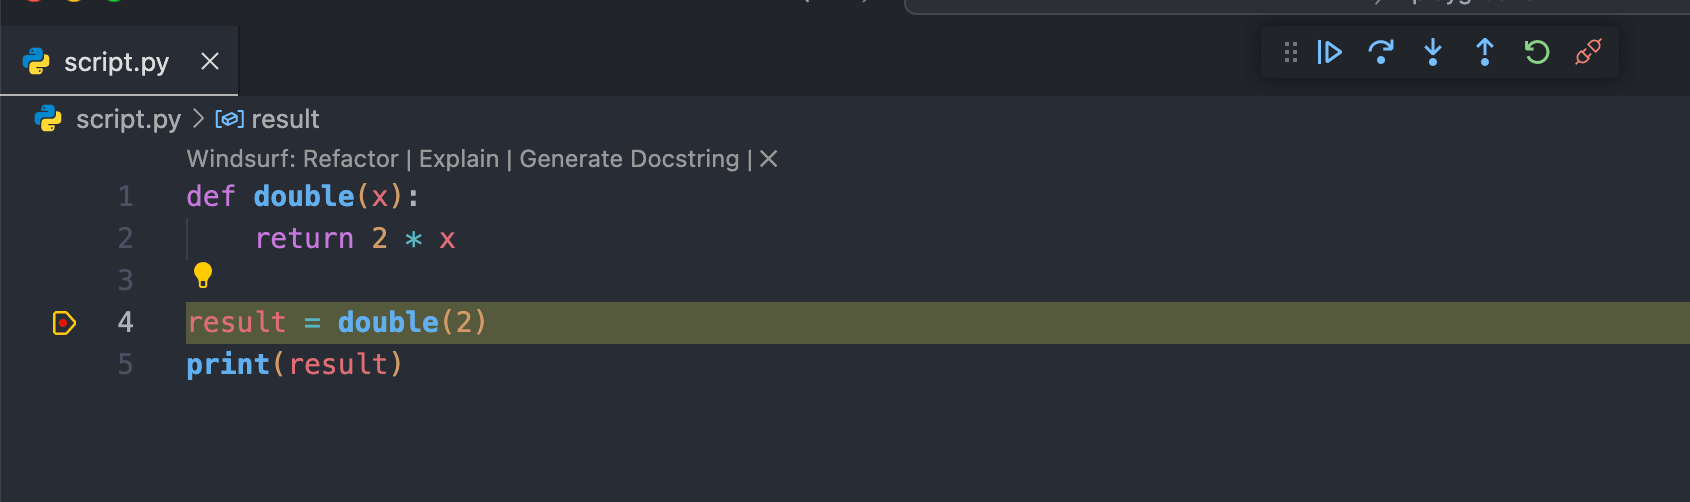
script.py
def double(x):
    return 2 * x

result = double(2)
print(result)
To start the debugger, run the command below. The debugger will listen on port 5678 and wait for the client editor to connect.
shell
python -m debugpy --listen 0.0.0.0:5678 --wait-for-client script.py If our script has to be called using another python module (FastAPI, streamlit, etc.), we can use the -m flag to specify the command.
shell
python -m debugpy --listen 0.0.0.0:5678 --wait-for-client \
    -m uvicorn main:app --host 0.0.0.0 --port 8000
I’m demonstrating this locally, but you can run the same command inside a Docker container or on a remote server. Just make sure to retrieve the appropriate IP address and port for the debugger to connect.
Step 2: Attach from local VSCode
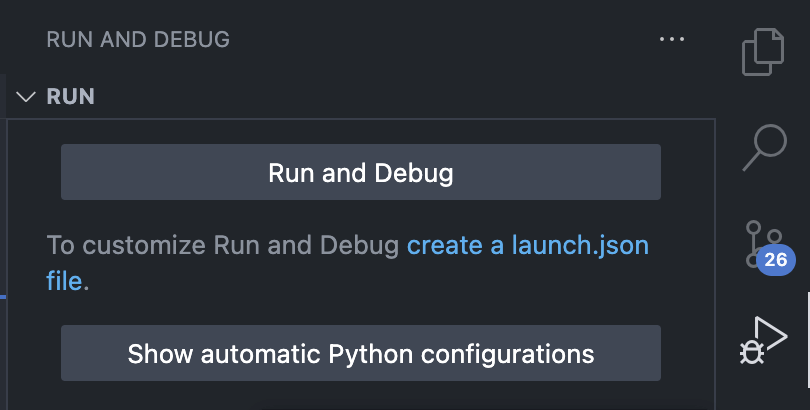
On VSCode, go to Run and Debug and then click on ‘create a launch.json file’.
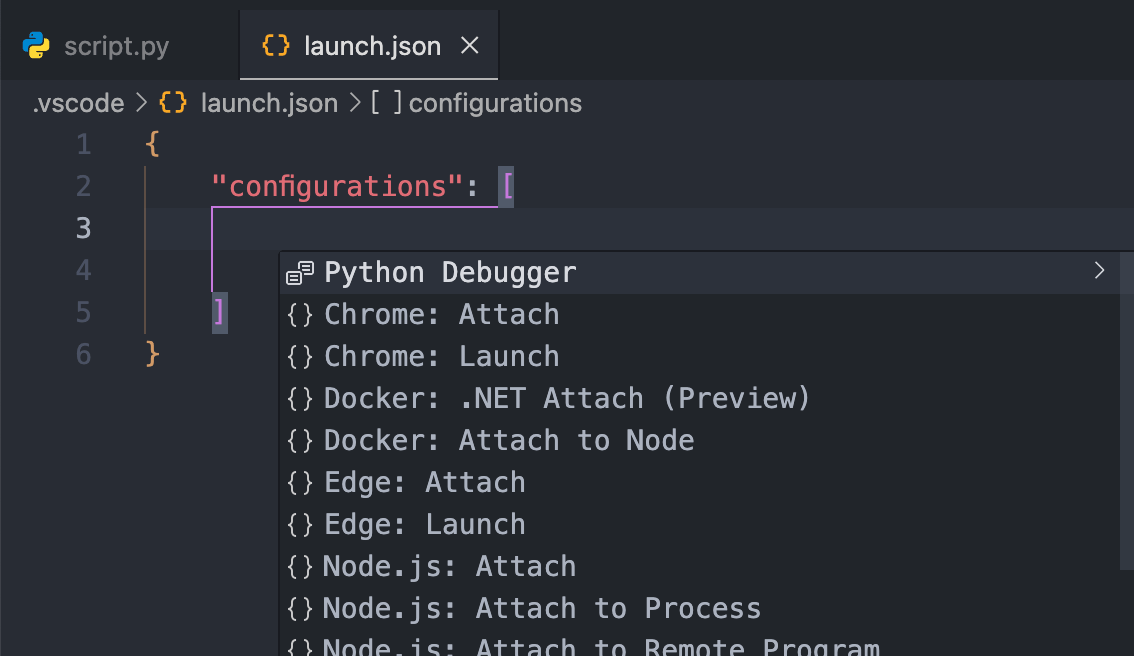
In the configuration file, you will be shown autocomplete options. Select Python Debugger.
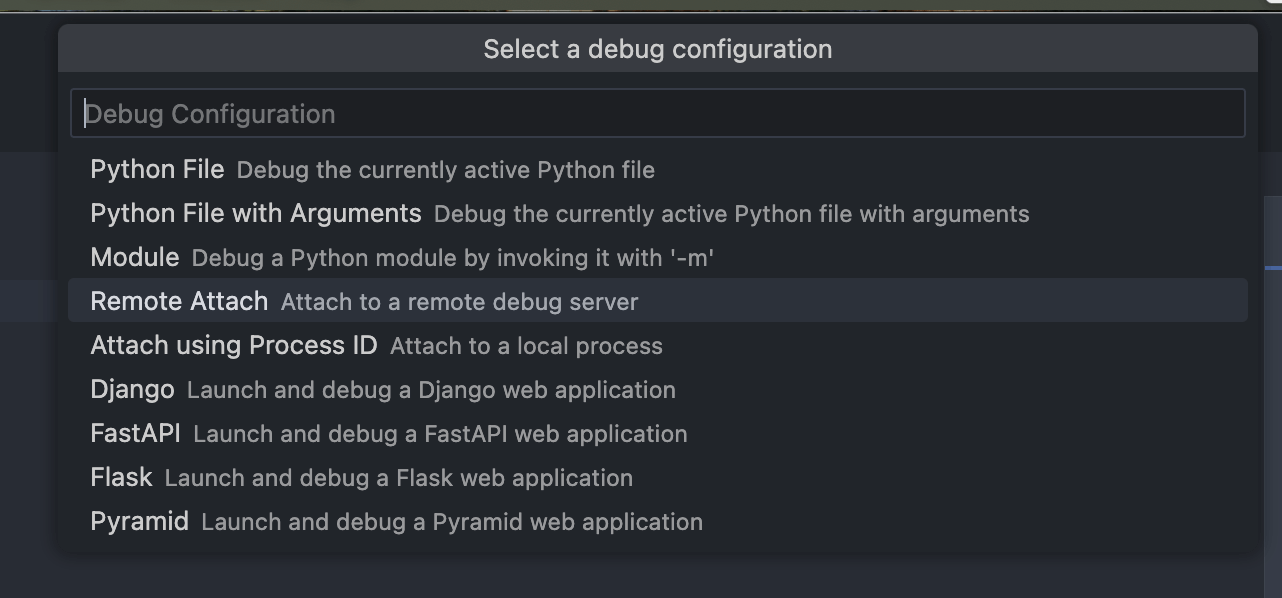
Among the debug configuration options, select Remote Attach.
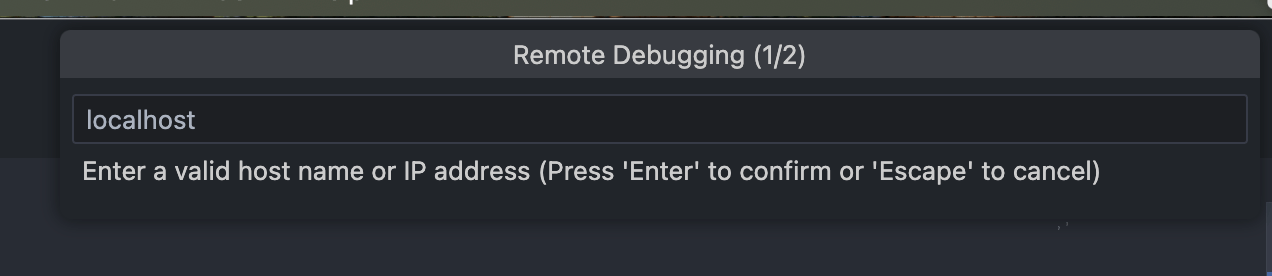
Set the hostname to the IP address of the server. For running locally, we can simply set it to localhost.
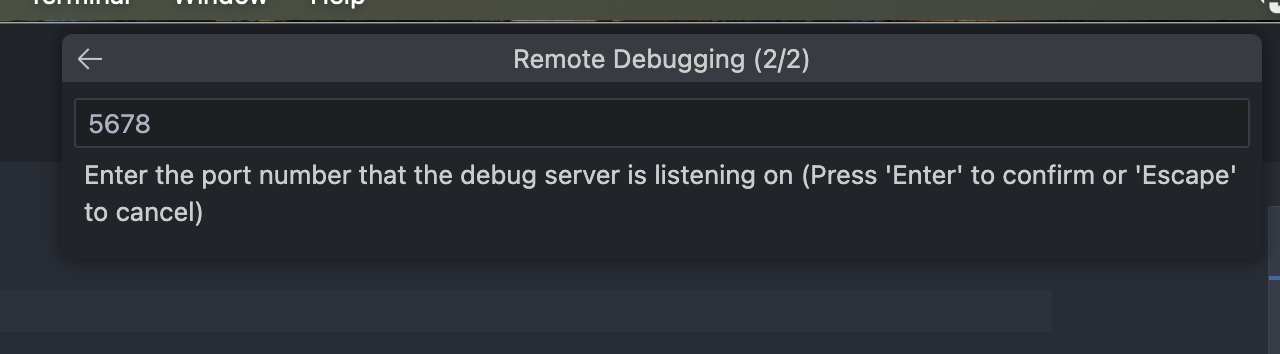
The port is set to 5678 by default.
Once this is done, we can set a breakpoint and start debugging with F5. The code will actually be run using debugpy in the virtual environment where it was installed.